



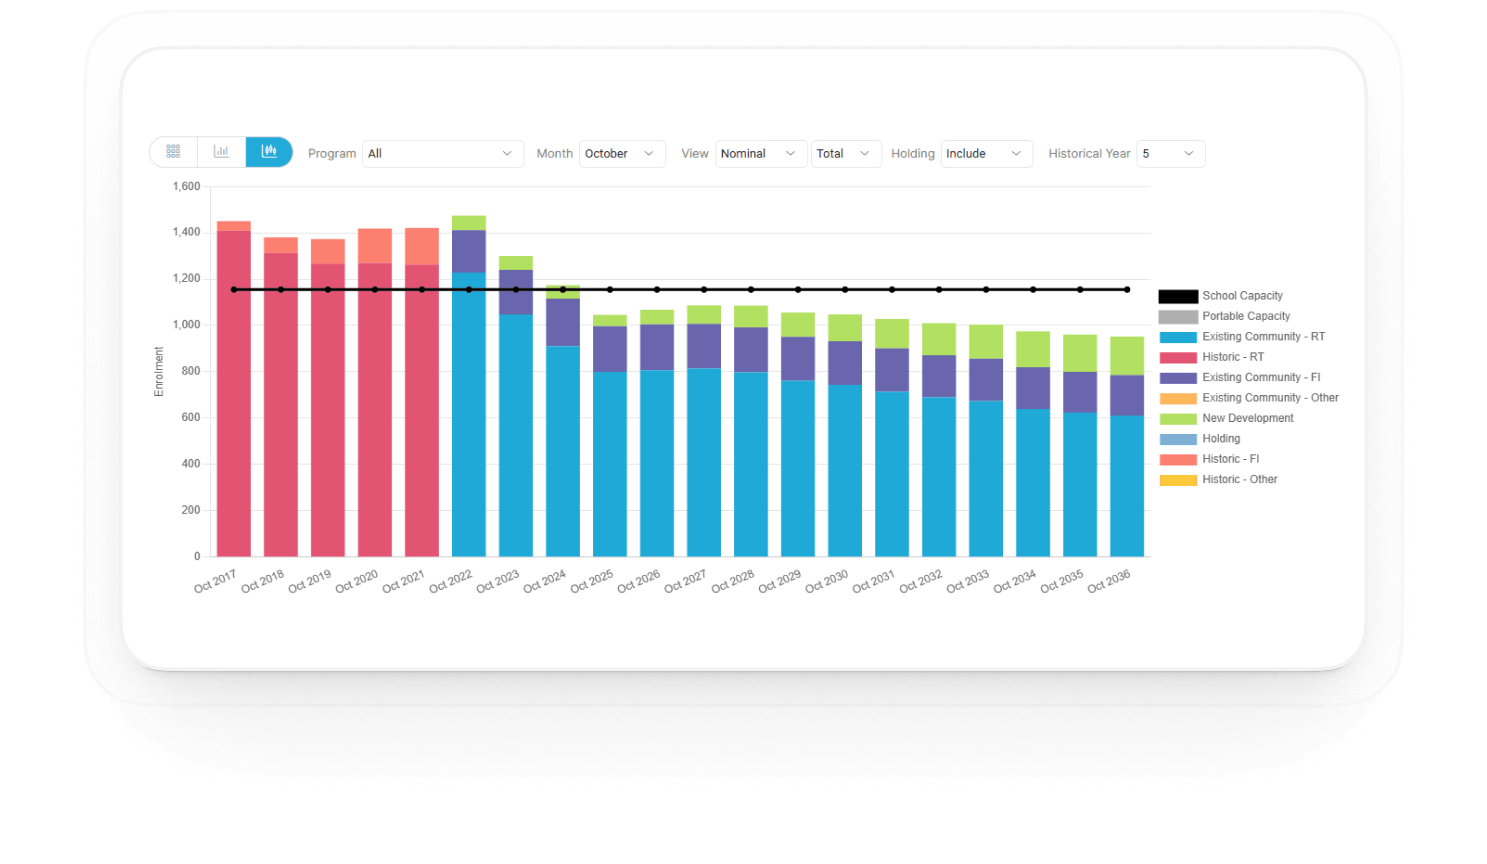

Bar chart showing enrollment data from October 2017 to October 2036 with stacked categories: Historic - RT, Existing Community - RT, Existing Community - FI, New Development, and others. A black line labeled School Capacity spans across at about 1100 enrollment. Enrollment peaks above 1400 in 2017-2022, then decreases and stabilizes under capacity from 2023 onward. The chart includes dropdowns for Program, Month, View, Total, Holding, and Historical Year selection.

Scenario-based planning software for School Districts

SPS+ helps school districts forecast enrollment, analyze school capacity and plan for growth years in advance using data-driven scenario modeling.

Request Demo
Proudly working with 2000+ Schools

SPS+ PlatformToronto Catholic District School BoardYork Catholic District School BoardDistrict School Board of NiagaraPeel District School BoardWaterloo Region District School BoardGrand Erie District School BoardHamilton-Wentworth Catholic District School BoardNear North District School BoardHalton District School BoardHalton Catholic District School BoardSchool District 60 Peace River NorthHamilton-Wentworth District School BoardDurham District School BoardUpper Grand District School boardThames Valley District School BoardToronto Catholic District School BoardYork Region District School BoardDufferin-Peel Catholic District School BoardToronto Catholic District School BoardYork Catholic District School BoardPeel District School BoardDistrict School Board of NiagaraGrand Erie District School BoardNear North District School BoardWaterloo Region District School BoardHalton Catholic District School BoardHamilton-Wentworth District School BoardHamilton-Wentworth Catholic District School BoardUpper Grand District School boardToronto Catholic District School BoardHalton District School BoardYork Region District School BoardThames Valley District School BoardSchool District 60 Peace River NorthDurham District School Board

A unified planning platform for enrollment, growth, and school utilization

SPS+ combines historic enrollment, housing development data and geographic analysis into a planning system designed for school districts.

Student Data

Development Data

Geography

Historical Trends

SPS+ Platform

Capacity planning

Enrollment Forecast

Redistricting options

Boundary analysis

School planning is often too reactive.

Capacity crises

Schools exceed capacity before planners can react

Spreadsheet chaos

Planning data scattered across spreadsheets

Development uncertainty

Housing growth isn't translated into enrollment impact

Difficult capital requests

Hard to justify new schools with weak projections
Five modules that power streamlined district planning

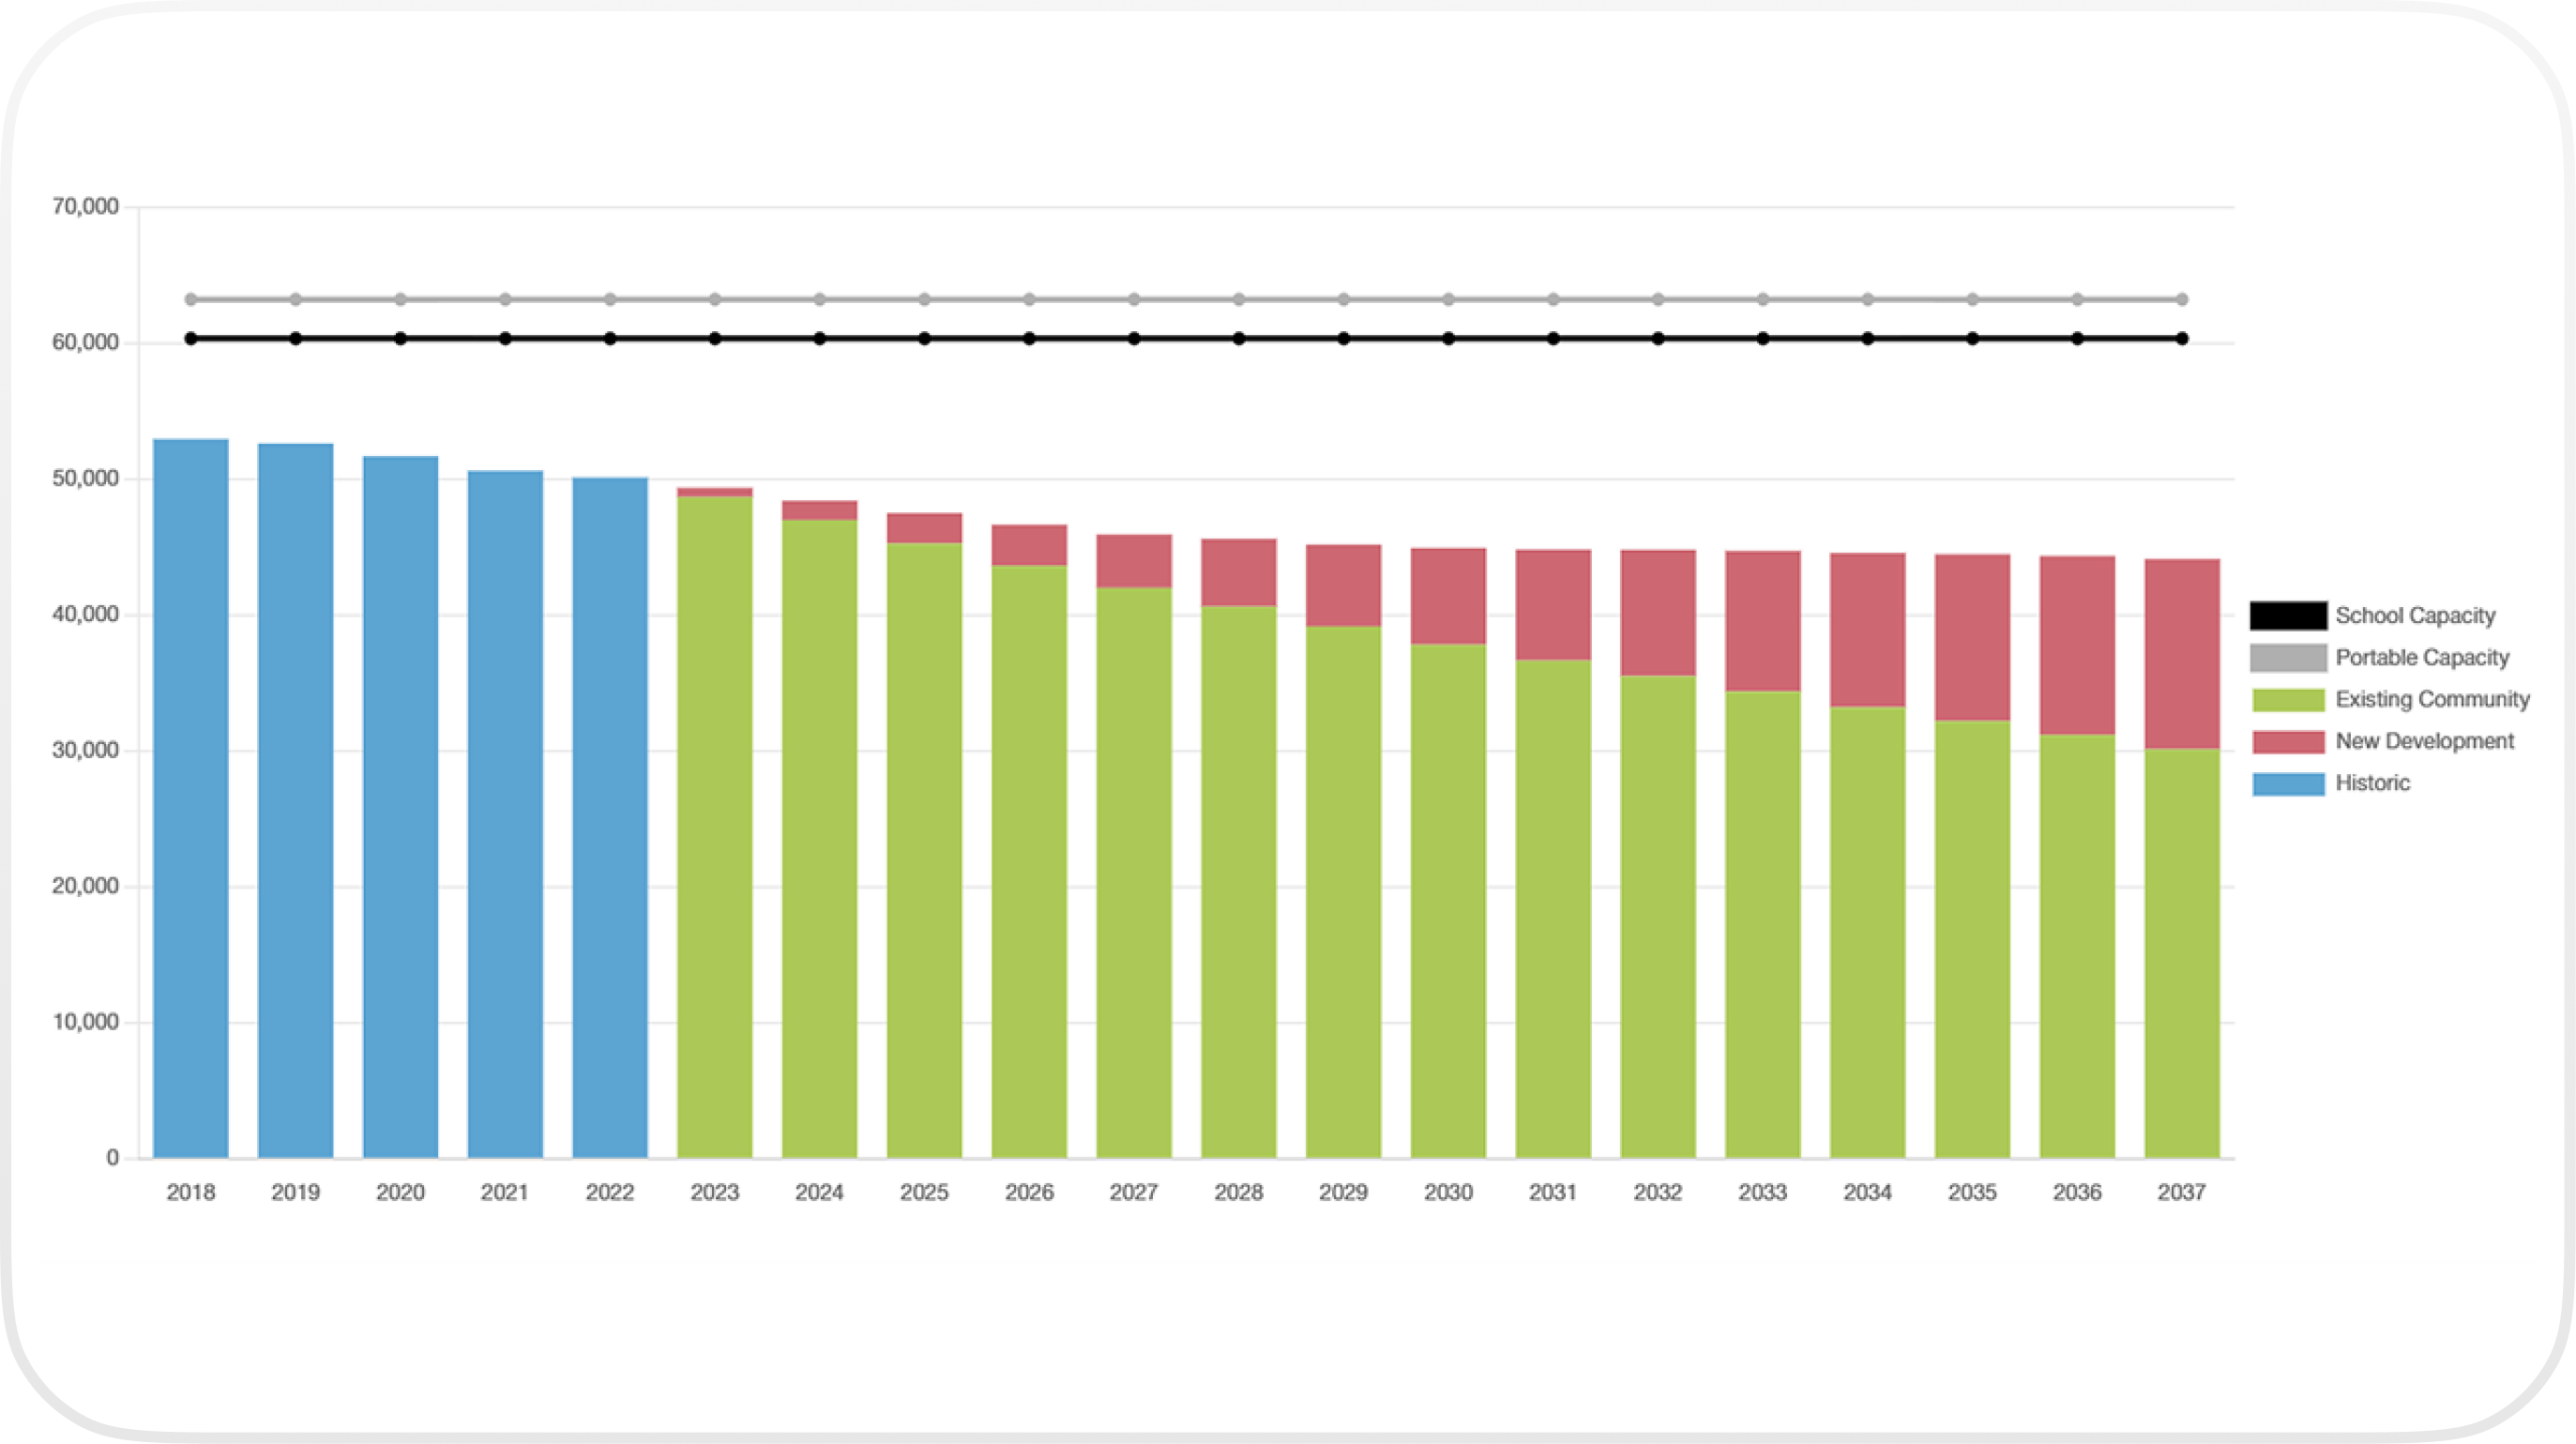
Bar chart showing enrollment projections from 2018 to 2037 with segments for Historic (blue, 2018-2022), Existing Community (green, 2023-2037), and New Development (red, from 2023). School Capacity is a black line near 60,000 slots, and Portable Capacity is a gray line slightly above it. Enrollment counts decrease from about 53,000 in 2018 to about 44,000 in 2037, with new development enrollment increasing from near zero in 2023 to nearly 14,000 in 2037.

Create and compare multiple planning scenarios to model enrollment growth, development impact, and district decisions over time.

More Info
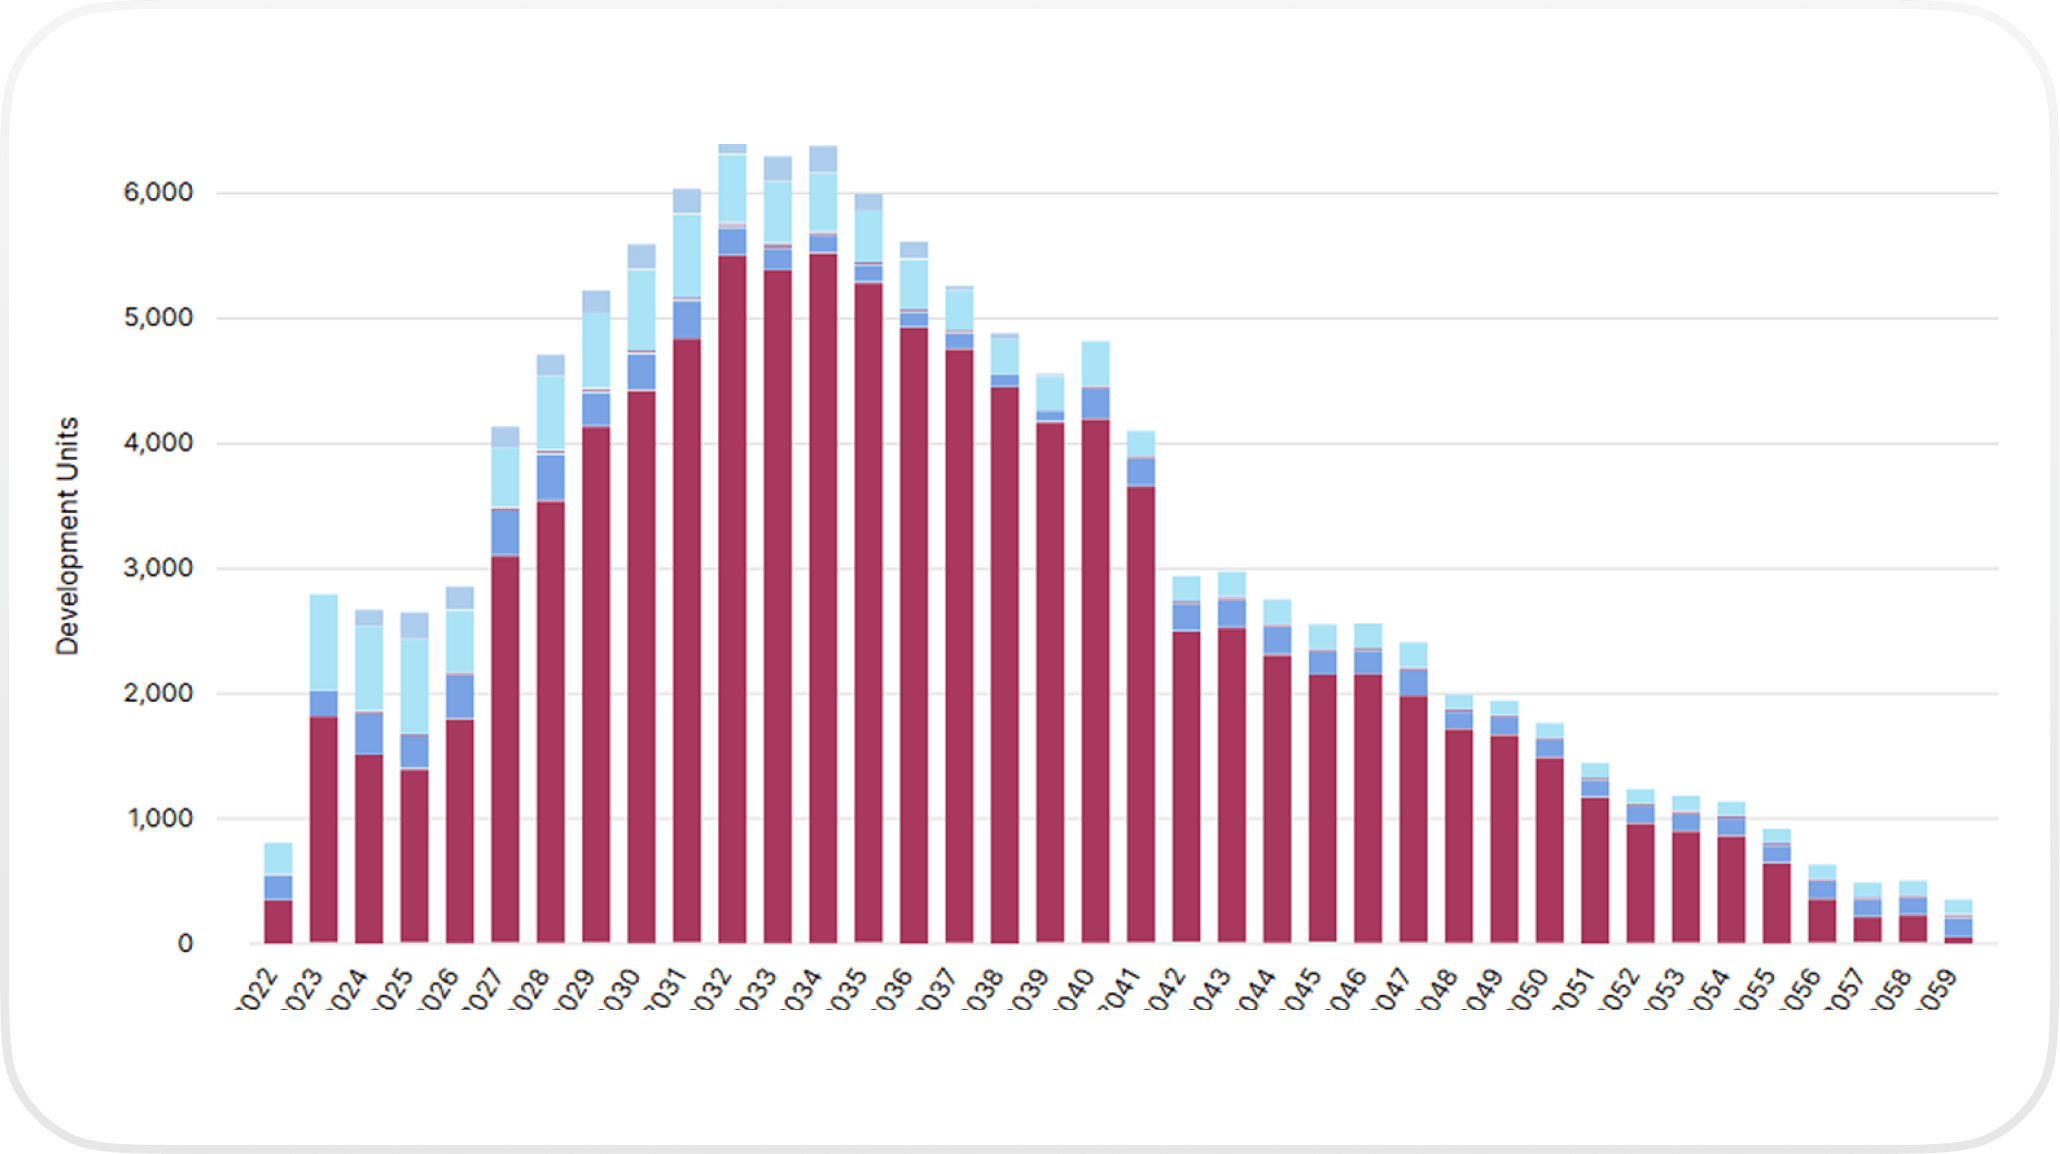
Stacked bar chart showing development units from years 2022 to 2059 with units peaking around 2033 at over 6,000 and declining steadily afterward.

Capture municipal development data and translate housing growth into projected student enrollment.

More Info
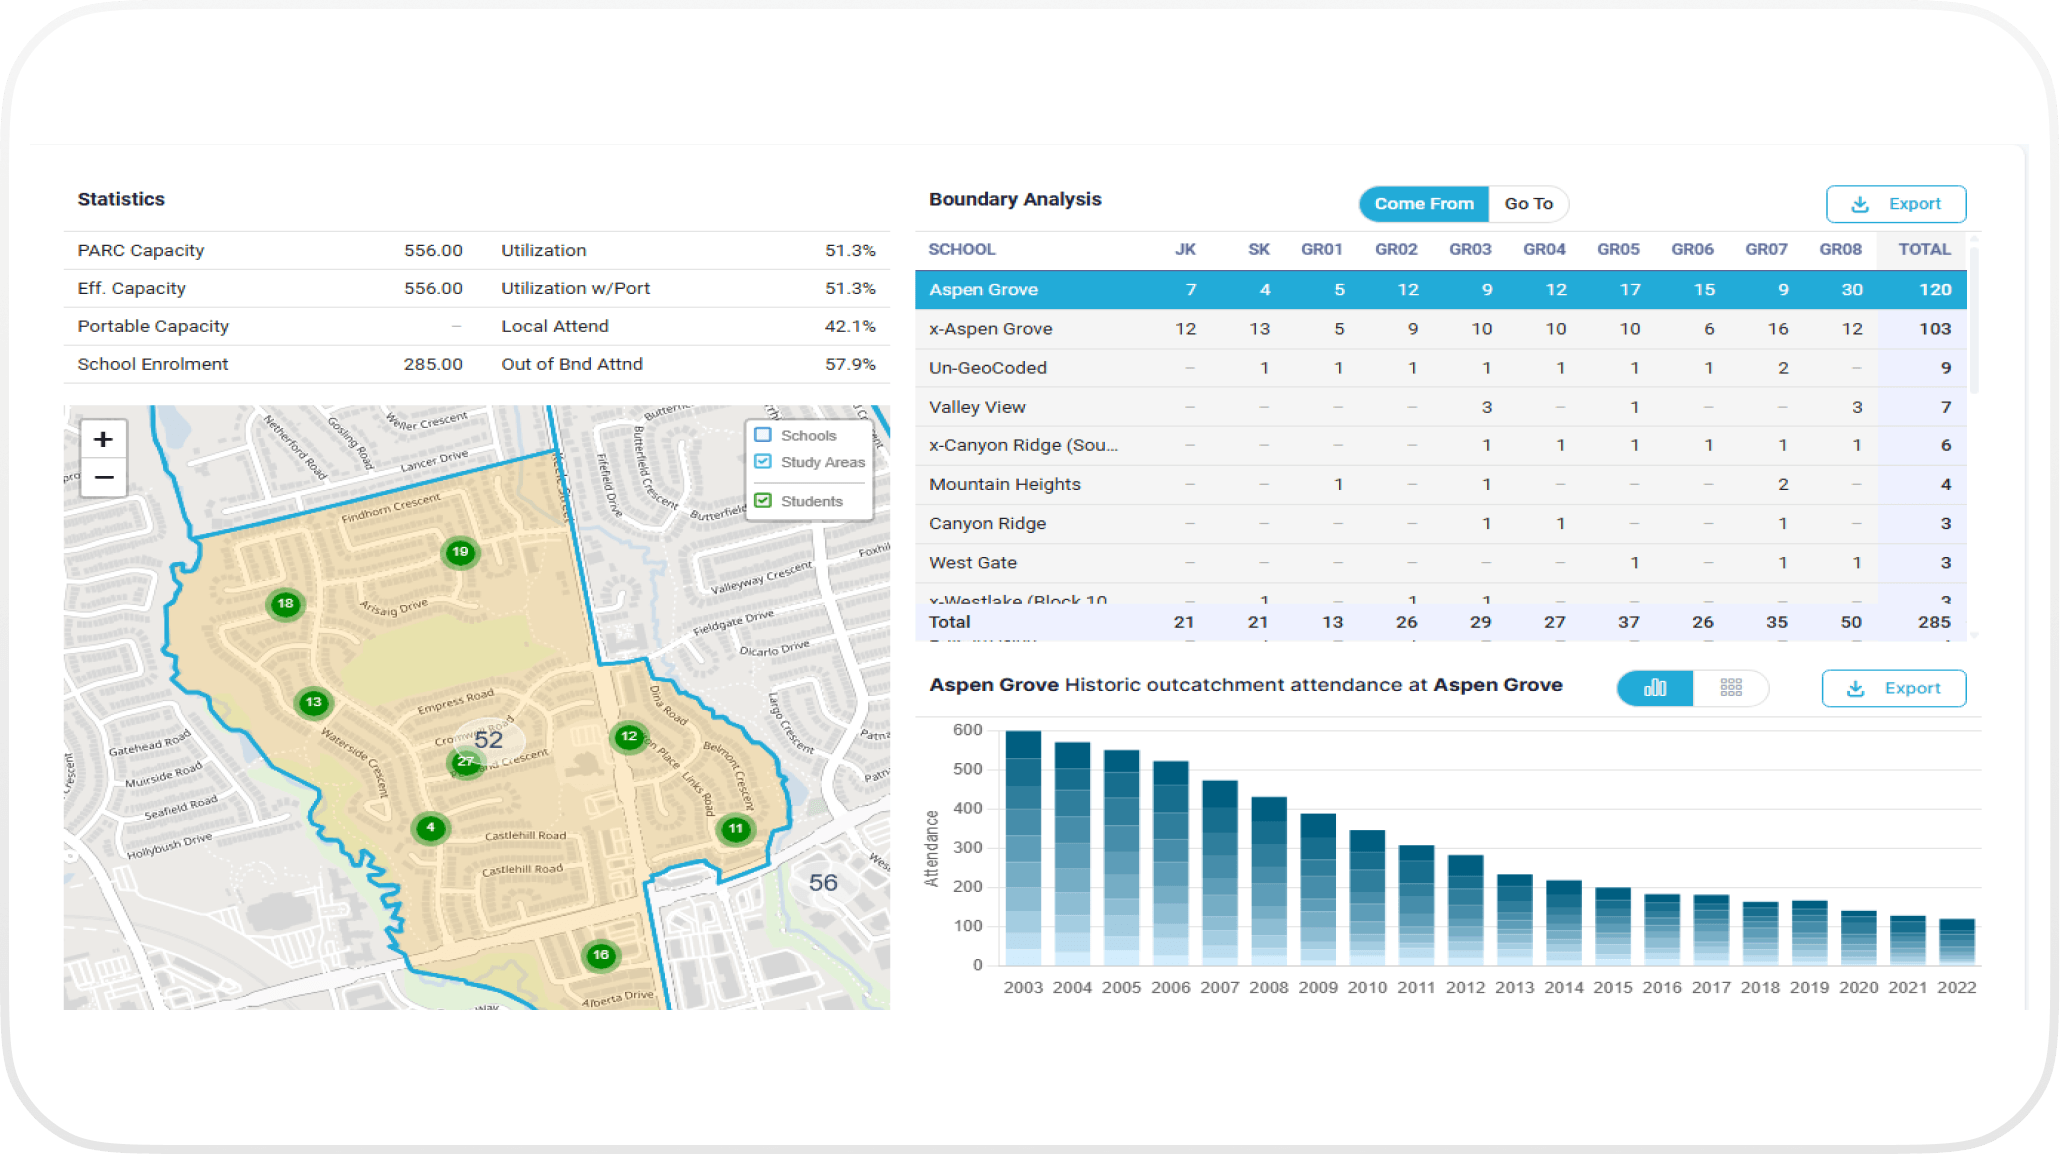
Dashboard showing school boundary analysis for Aspen Grove with statistics of capacity and utilization, a map highlighting the study area with student counts at various locations, a table listing student distribution by grade and school, and a bar chart showing historic attendance from 2003 to 2022 declining over time.

Analyze how students attend schools relative to boundaries and identify utilization pressures across the district.

More Info
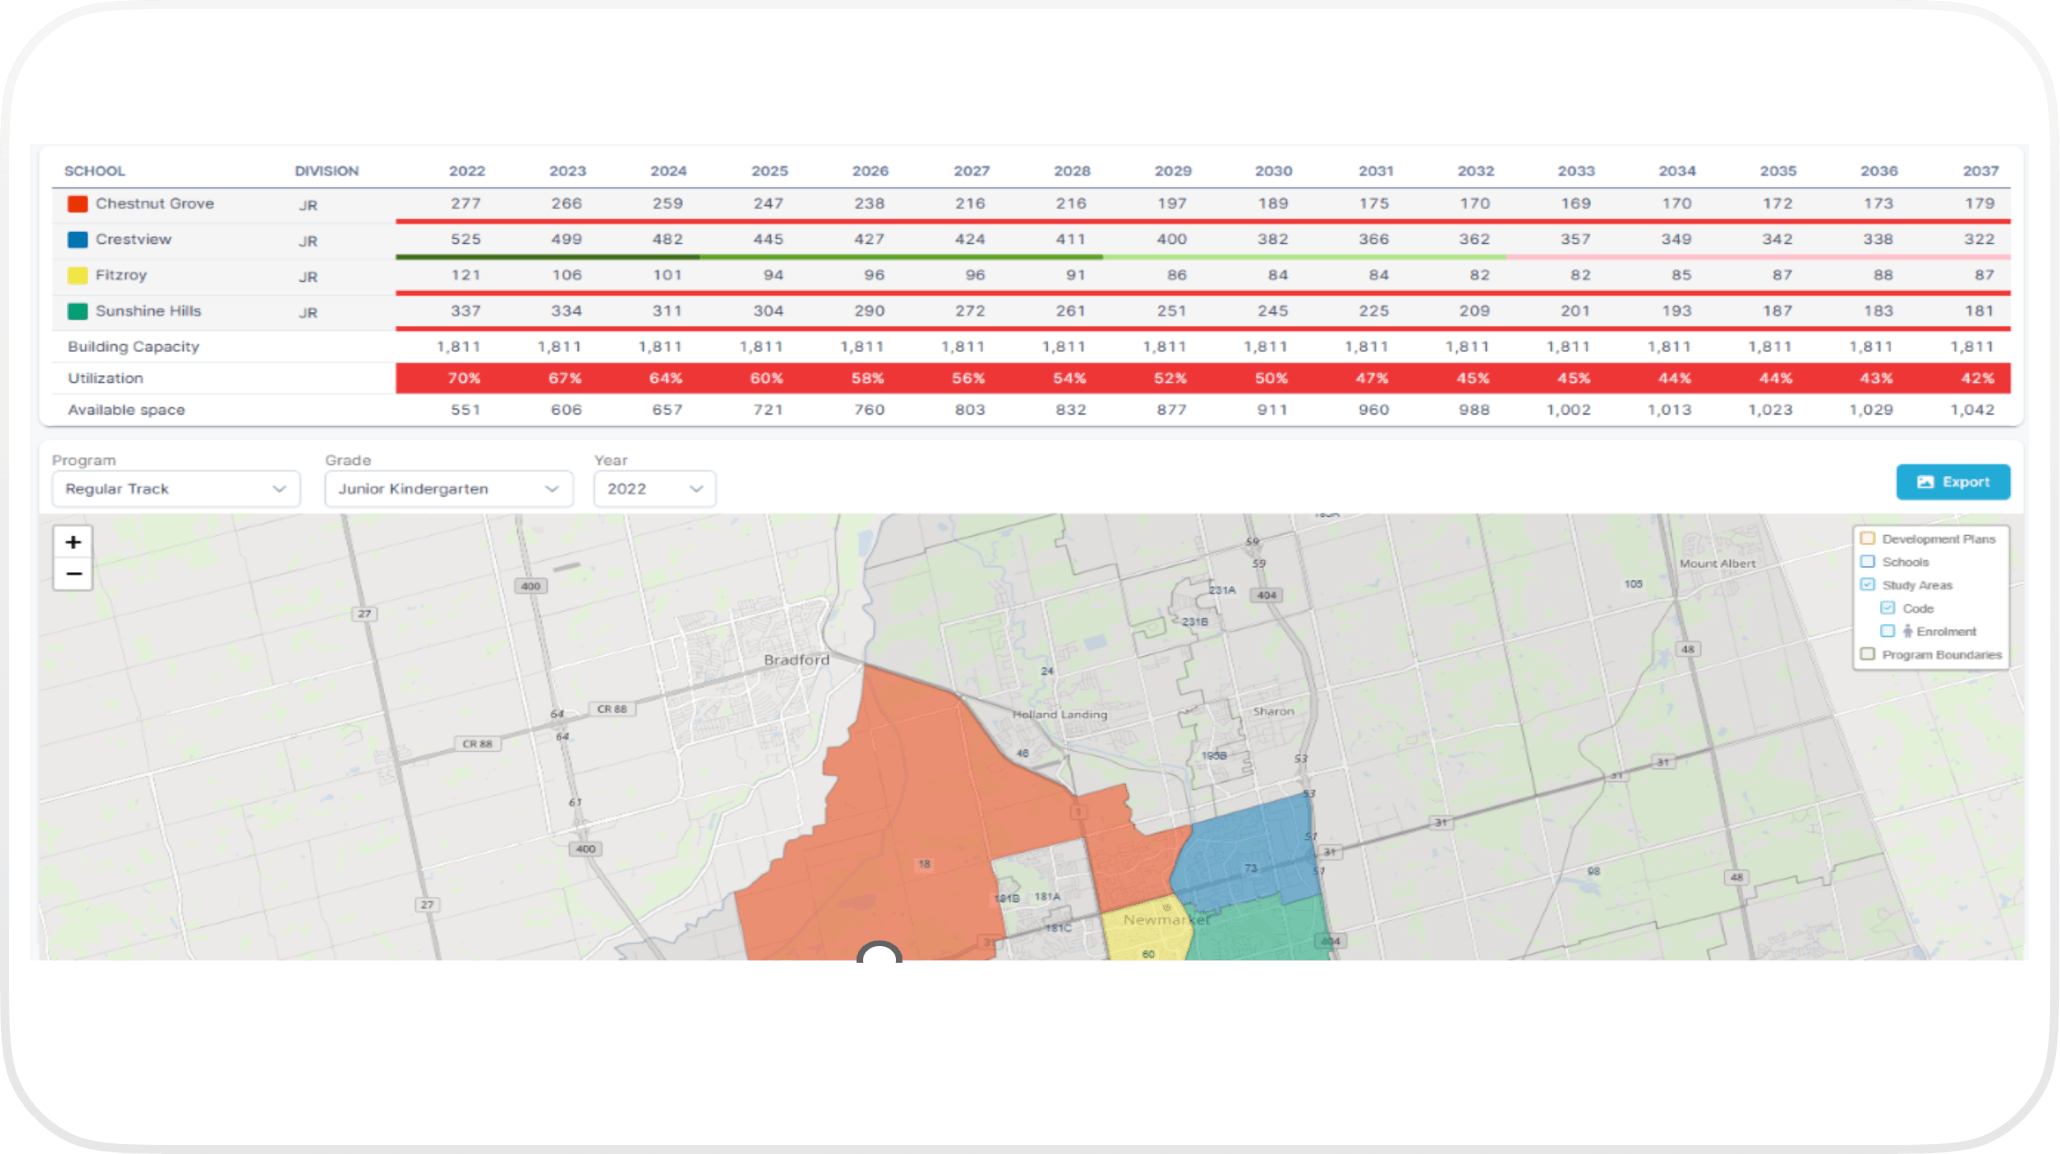
Table showing projected enrollment numbers for junior division schools Chestnut Grove, Crestview, Fitzroy, and Sunshine Hills from 2022 to 2037, with building capacity, utilization rates decreasing from 70% to 42%, and available space increasing. Below the table, map with colored polygons representing school boundaries for Chestnut Grove in orange, Crestview in blue, Fitzroy in yellow, and Sunshine Hills in green. Dropdown menus for program type, grade, and year appear above the map, showing selections Regular Track, Junior Kindergarten, and 2022, with zoom controls on the left and a legend on the right indicating development plans, schools, study areas, enrollment, and program boundaries.

Evaluate redistricting and capacity solutions by testing how enrollment changes affect schools over time.

More Info
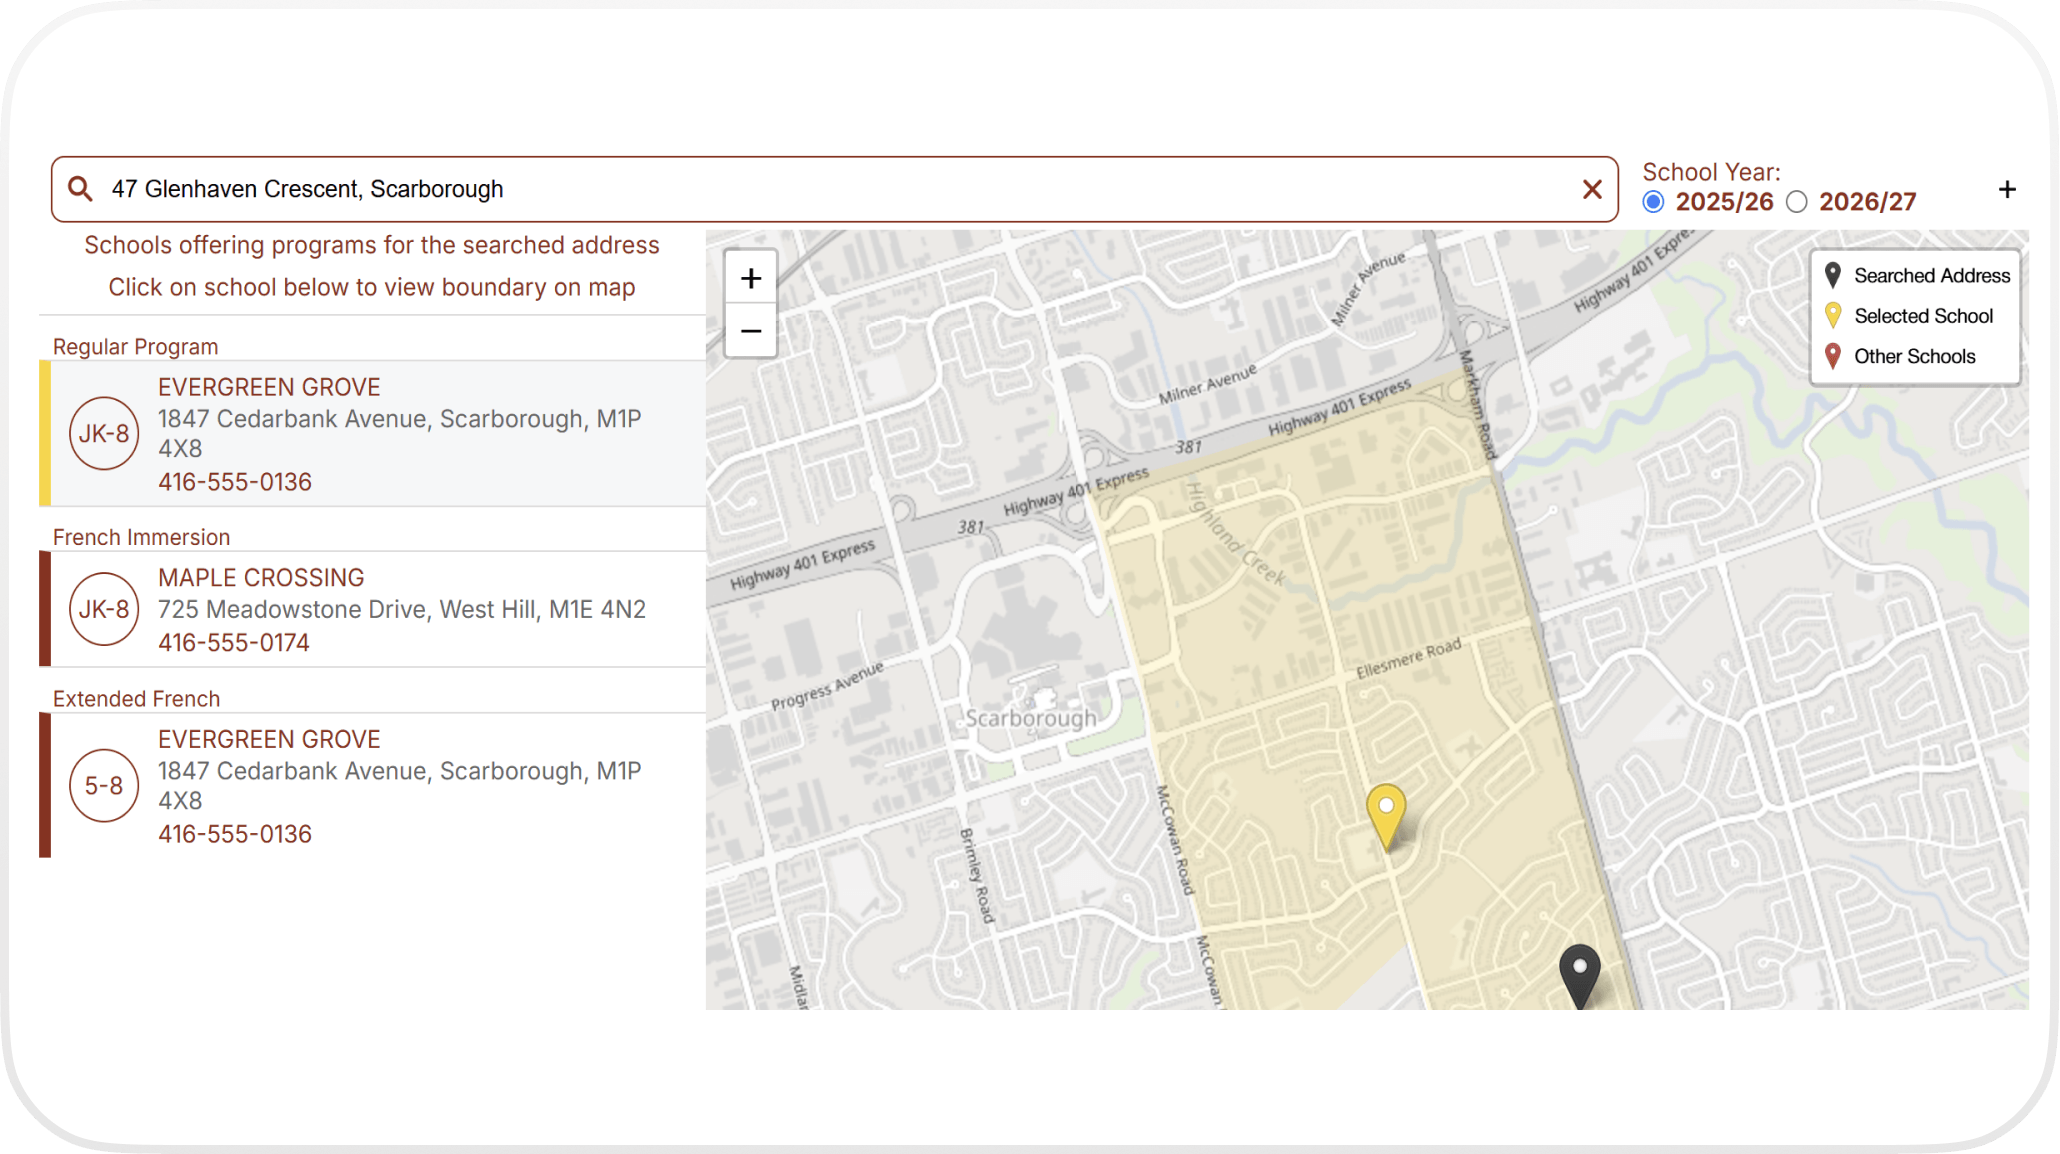
Map interface showing schools offering programs near 47 Glenhaven Crescent, Scarborough for the 2025/26 school year with highlighted attendance boundaries, including Evergreen Grove for JK-8 and Extended French 5-8, and Maple Crossing for French Immersion JK-8, each with addresses and phone numbers listed.

Provide accurate boundary and program information to the public through an embeddable address-based school locator.

More Info

Built for the people planning the future of school districts

SPS+ is designed for the teams responsible for forecasting enrollment, planning school capacity, and ensuring districts stay ahead of growth and change.

The planners responsible for enrollment forecasting,
capital planning, and boundary reviews.

Model enrollment projections 10–15+ years into the future

Understand how housing development impacts school capacity

Evaluate redistricting and boundary scenarios

Build defensible planning recommendations

Superintendents and executive leadership
responsible for strategic decisions.

Understand long-term enrollment trends and school capacity needs

Evaluate capital planning scenarios

Support capital funding requests with clear projections.

Make confident decisions backed by data

The technical teams responsible for
maintaining district data and geographic analysis.

Integrate student data with geographic planning models

Visualize enrollment trends across catchment areas

Analyze boundary utilization and geographic pressure points

Seamlessly import and geocode student data

Plan the future of your district with confidence.

See how SPS+ helps school districts anticipate enrollment changes, evaluate planning scenarios, and make better long-term decisions.